DATA
SCIENCE
Beim Institut für Qualitäts-und Zuverlässigkeitsmanagement, kurz IQZ.
Data Science
mal anders!
Nutzen Sie schon das volle Potential Ihrer Daten? Welche technischen oder betriebswirtschaftlichen Mehrwerte lassen sich daraus ableiten? Welche Muster und Auffälligkeiten beinhalten Ihre Daten? Welche Zusammenhänge und Vorhersagen können aus Ihren Daten abgeleitet werden?
Sie sehen gerade einen Platzhalterinhalt von YouTube. Um auf den eigentlichen Inhalt zuzugreifen, klicken Sie auf die Schaltfläche unten. Bitte beachten Sie, dass dabei Daten an Drittanbieter weitergegeben werden.
Mehr Informationen
Data Science
Wir vom IQZ helfen Ihnen dabei, diese und weitere Fragestellungen durch die Analyse Ihrer Daten zu beantworten. Die Schlagworte Industrie 4.0, Big Data, kurze Entwicklungszyklen und Agilität in der Entwicklung fallen in der heutigen Zeit mit hoher Wahrscheinlichkeit, wenn Herausforderungen von Unternehmen thematisiert werden. Diese Herausforderungen sind nur mittels Data Science zu bewältigen, wenn alle zur Verfügung stehenden Daten systematisch genutzt werden.
Mit unserem Expertenwissen analysieren wir Ihre Daten und helfen Ihnen, diese Daten gewinnbringend für Ihr Unternehmen zu nutzen.
Unsere
Leistungen
- Initial-Workshops und Check Ihrer Datenstruktur
- Ermittlung und Visualisierung von Kennzahlen
- Datengestützte Ursachenanalyse
- Rückführung von Feldinformationen in den Entwicklungsprozess
- Informationsgenerierung für neue Geschäftsmodelle (z.B. Pay per Use, Predictive Maintenance etc.)
- Erkennung von Anomalien und Muster (z.B. im Gewährleistungsmanagement)
- Analyse von Echtzeitdaten aus dem Feld
- Modellierung von Zuverlässigkeitsszenarien
- Erstellung von Forecasting Modellen
- Prozessoptimierung in der Fertigung anhand von Prozess- und Maschinendaten
Data Science - Eine Kurzeinführung
Die Qualität von Produkten ist eine Eigenschaft, die Kunden bewusst wahrnehmen und die maßgeblich über den Kauf eines Produkts entscheiden kann. Kritisch sind bei mangelnder Qualität vor allem schlecht quantifizierbare Risiken, wie z.B. Imageverlust oder die negative Berichterstattung. Folglich ist es für Unternehmen enorm wichtig, ein hohes Qualitätsniveau auch bei steigender Produktkomplexität und zunehmendem Preisdruck sicherzustellen. Mit Hilfe von Data Analytics kann dies gelingen. Data Analytics bezeichnet den wissenschaftlichen Vorgang zur Extraktion und Analyse von Daten. Ziel ist es, durch die Auswertung vorhandener Daten, Schlussfolgerungen oder Zusammenhänge zu ermitteln. So kann beispielsweise die Analyse von vorhandenen Gewährleistungsdaten dabei helfen, zukünftig im Feld aufkommende Qualitätsprobleme vorzeitig zu erkennen oder gemeinsam auftretende Schäden zu identifizieren.
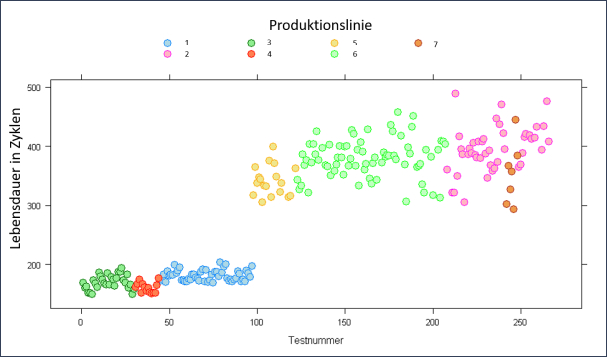
Die nachfolgende Abbildung zeigt auf, wie sich unterschiedliche Produktionslinien eines gleichen Produktes auf die Lebensdauer auswirken. Damit können z.B. Prozessoptimierungen diskutiert oder Cluster für Feldaktionen bestimmt werden.

Das Fachgebiet der Data Analytics ist breit gefächert. Durch die Erstellung von Reports, Kennzahlen, Drilldowns und Alerts wird der Zugang und der Überblick zu einer großen Datenmenge geschaffen. Dies ist von besonderem Interesse, um beispielsweise den Zeitpunkt, die Hintergründe und die Häufigkeit gewisser Ereignisse aus den vorhandenen Daten zu ermitteln. Darüber hinaus kann durch statistische Methoden erarbeitet werden, welche Ursachen den Abweichungen oder Auffälligkeiten in der Datenmenge zu Grunde liegen. Mit Hilfe von Forecasts und Optimierungen können Prognosen mit einer Aussagewahrscheinlichkeit aufgestellt oder Trends bestimmt werden. Die Beantwortung dieser Fragestellungen mit Hilfe von Data Analytics bietet neue Chancen, um datengetrieben Prozesse zu steuern, zu überwachen und zu optimieren. Mit steigender Komplexität der Fragestellungen und mit steigender Datenmenge wird auch die Analyse zunehmend komplexer, sodass wir auf eine Vielzahl von Methoden zurückgreifen, um diese Herausforderung mit Ihnen zu bewältigen.
Diese Abbildung zeigt eine Streudiagramm Matrix, welche die Korrelation verschiedener Einflussgrößen auf eine messbare Zielgröße aufzeigt. Damit können visuell Muster bei den Einflussgrößen erkannt werden. Neben der grafischen Auswertung erfolgt auch eine mathematische Wichtung der Einflussgrößen.
Die nachfolgende Abbildung zeigt auf, wie sich unterschiedliche Produktionslinien eines gleichen Produktes auf die Lebensdauer auswirken. Damit können z.B. Prozessoptimierungen diskutiert oder Cluster für Feldaktionen bestimmt werden.
Folgende Methoden werden auszugsweise von uns angewandt:
- Regressionsanalysen und Parameterreduktionsverfahren (z.B. Shrinkage, Ridge, Lasso)
- Varianzanalyse (ANOVA)
- Visualisierungsverfahren
- Neuronale Netze
- Optimierungsverfahren
- Machine Learning
- Bayessche Statistik
- Simulation
- Stochastische Modelle
Methodenportfolio:
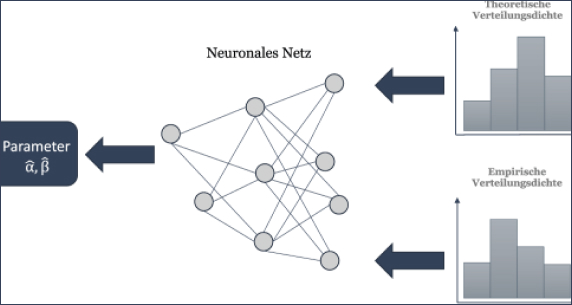
Neuronale Netze
Künstliche Neuronale Netze (KNN) dienen der Modellbildung und –lösung. Sie sind in der Lage, abstrakte Strukturen zu generalisieren und Muster auch bei unvollständigen oder verrauschten Daten zu erkennen. Das eigentliche Modell ist als Black-Box anzusehen, innerhalb welcher das Modell von den Eingangsparametern bis zur Lösung über künstliche Neuronen und deren Verknüpfung abgebildet wird, wodurch sich der Begriff des Neuronalen Netzes begründet (siehe folgende Abbildungen: Neuronale Netze)

Ausgewählte Referenzen:
- Lebensdauerprognose unter Berücksichtigung wechselnder klimatischer Bedingungen.
- Ermittlung und Visualisierung von Kennzahlen
- Datengestützte Ursachenanalyse
- Rückführung von Feldinformationen in den Entwicklungsprozess
- Informationsgenerierung für neue Geschäftsmodelle (z.B. Pay per Use, Predictive Maintenance etc.)
Künstliche Neuronale Netze sind insbesondere dann von Nutzen, wenn die Fragestellung sehr komplex und die mathematische Beschreibung (Modell) sowie die Lösung der Fragestellung praktisch nicht möglich sind (mangelnde Kenntnis über die Einflussgrößen und die funktionalen Zusammenhänge). Typische Anwendungsfälle der KNN sind z.B. Parameterschätzung (z.B. Anpassung mehrparametrige Weibull-Funktion), Lebensdauerprognose (z.B. unter Berücksichtigung klimatischer Einflussgrößen) bis hin zur Prognose von Aktienkursen.
Ihre Herausforderung:
- Sie konnten mit herkömmlichen Methoden kein zufriedenstellendes Ergebnis erzielen, Daten und Grundlagen zur Modellbildung lagen nicht vor?
Wir bieten Ihnen die mathematische Beschreibung und KNN-basierte Lösungen Ihrer individuellen Fragestellungen – sprechen Sie uns an, wir helfen Ihnen gerne.
Fuzzy-Logik
Die Fuzzy-Logik ermöglicht es, dass in der Organisation oder bei Experten vorhandene subjektive Wissen nutzbar zu machen und in bestehende Ansätze der Sicherheits- und Zuverlässigkeitsanalyse zu integrieren (siehe Abb. Fuzzy-Logik). Ein weiterer Vorteil ist, dass die Unschärfe und Subjektivität der Eingangsdaten bei den Analyseergebnissen erkennbar bleibt.
Die Fuzzy-Logik hat sich im Rahmen der Sicherheits- und Zuverlässigkeitsanalyse bei der Integration von unscharfen Daten (z.B. Ausfallraten) in Kombination mit Werkzeugen wie der FMECA oder dem Fehlerbaum bewährt. Hierbei erfolgt zunächst eine Fuzzifizierung der unscharfen Daten (Umsetzung in ein gegebenes Gerüst der unscharfen Mathematik). Anschließend wird das Ergebnis gemäß der Rechenregeln des übergeordneten Werkzeugs (FMECA, Fehlerbaum, etc.) generiert, die folgende Defuzzifizierung des Ergebnisses dient der Umsetzung des unscharfen Ergebnisses in einen konkreten Wert.
Ausgewählte Referenzen:
- Fuzzy-FMEA zur Gefährdungsanalyse eines Druck-Tank-Systems
- Fuzzy-Fehlerbaumanalyse für ein Kfz-Sensorik-System
- Methodischer Vergleich der Booleschen- und Fuzzy-Fehlerbaumanalyse am Beispiel eines Flugsteuerungssystems

Ihre Herausforderung:
- Ihr System verfügt über Unsicherheiten, eine Ermittlung konkreter Eingangsgrößen (z.B. Auftretenswahrscheinlichkeiten, Entdeckungswahrscheinlichkeiten, Ausfallraten) ist nicht möglich?
- Herangezogene Experten sind uneins bei der Ermittlung der Eingangsgrößen (z.B. Auftretenswahrscheinlichkeiten, Entdeckungswahrscheinlichkeiten, Ausfallraten)?
Wir bieten Ihnen die mathematische Beschreibung und KNN-basierte Lösungen Ihrer individuellen Fragestellungen – sprechen Sie uns an, wir helfen Ihnen gerne.
Evolutionäre Algorithmen
Evolutionäre Algorithmen (EA) sind Optimierungsverfahren, welche sich angelehnt an die natürliche Evolution einer gesuchten Lösung annähern. In jeder Iteration werden anhand einer Zielfunktion die besten Lösungen bewertet und selektiert. Für die folgende Iteration werden die bestehenden Lösungen rekombiniert sowie mutiert, wodurch sich die Nähe zum Begriff Evolution begründet.
Evolutionäre Algorithmen sind insbesondere dann von Nutzen, wenn das Optimierungsproblem sehr komplex und die mathematische Beschreibung (Modell) sowie die Lösung der Fragestellung (z.B. mittels numerischer Verfahren) aufwendig sind. Typische Anwendungsfälle der Evolutionären Algorithmen sind z.B. Parameterschätzung (z.B. Anpassung mehrparametrige Weibull-Funktion), Systemdesign (z.B. Gewicht Kabelbaum, Temperaturbelastung Steuergerät, Turbulenzbelastung innerhalb eines Windparks).
Ausgewählte Referenzen:
- Weibull-Analyse unter Berücksichtigung eines Teilpopulationsmodells
- Zuverlässigkeitsprognose im Bereich der automobilen Telekommunikation
- Optimierung und vage Daten im Entwicklungsprozess
Ihre Herausforderung:
- Sie konnten mit herkömmlichen Methoden kein zufriedenstellendes Ergebnis erzielen, numerische Verfahren lieferten keine brauchbaren Lösungen?
Wir bieten Ihnen die mathematische Beschreibung und EA-basierte Lösungen Ihrer individuellen Fragestellungen – sprechen Sie uns an, wir helfen Ihnen gerne.

Nehmen Sie Kontakt auf!
Andreas Braasch
- +49 (0)202 – 515 616 90
- info@iqz-wuppertal.de